Would you like to use Wallpapers.com in English?
Laptop Wallpapers
(1800+ Laptop Wallpapers)
Elevate your laptop style with our collection of vibrant and dynamic wallpapers. Choose from stunning nature landscapes, inspiring quotes, or bold abstract designs to match your unique personality.
-
![Project Management Charts And Graphs Wallpaper]()
Project Management Charts And Graphs Wallpaper -
![Total War Warhammer Gryphon And Wyvern Aerial Battle Wallpaper]()
Total War Warhammer Gryphon And Wyvern Aerial Battle Wallpaper -
![Handsome Wrestler Brock Lesnar Wallpaper]()
Handsome Wrestler Brock Lesnar Wallpaper -
![Mutual Enterprise Intelligence Wallpaper]()
Mutual Enterprise Intelligence Wallpaper -
![Ken Duke golfing in the sun Wallpaper]()
Ken Duke golfing in the sun Wallpaper -
![Bed Of Red Roses Laptop Wallpaper]()
Bed Of Red Roses Laptop Wallpaper -
![Tasmania Grassy Sea Wallpaper]()
Tasmania Grassy Sea Wallpaper -
![Sad Gohan Super Saiyan 2 Wallpaper]()
Sad Gohan Super Saiyan 2 Wallpaper -
![Gabon Border With Cameroon Wallpaper]()
Gabon Border With Cameroon Wallpaper -
![Re-Imagined Valorant Champ Reyna Wallpaper]()
Re-Imagined Valorant Champ Reyna Wallpaper -
![Inclusive Workplace Hd Wallpaper]()
Inclusive Workplace Hd Wallpaper -
!["Stay Powered Up With This Adorable Kawaii Laptop" Wallpaper]()
"Stay Powered Up With This Adorable Kawaii Laptop" Wallpaper -
![A Must See Temple Of Poseidon Wallpaper]()
A Must See Temple Of Poseidon Wallpaper -
![Indie Aesthetic Laptop Triangle On Sky Wallpaper]()
Indie Aesthetic Laptop Triangle On Sky Wallpaper -
![Rover Operator Supervising And Observing Wallpaper]()
Rover Operator Supervising And Observing Wallpaper -
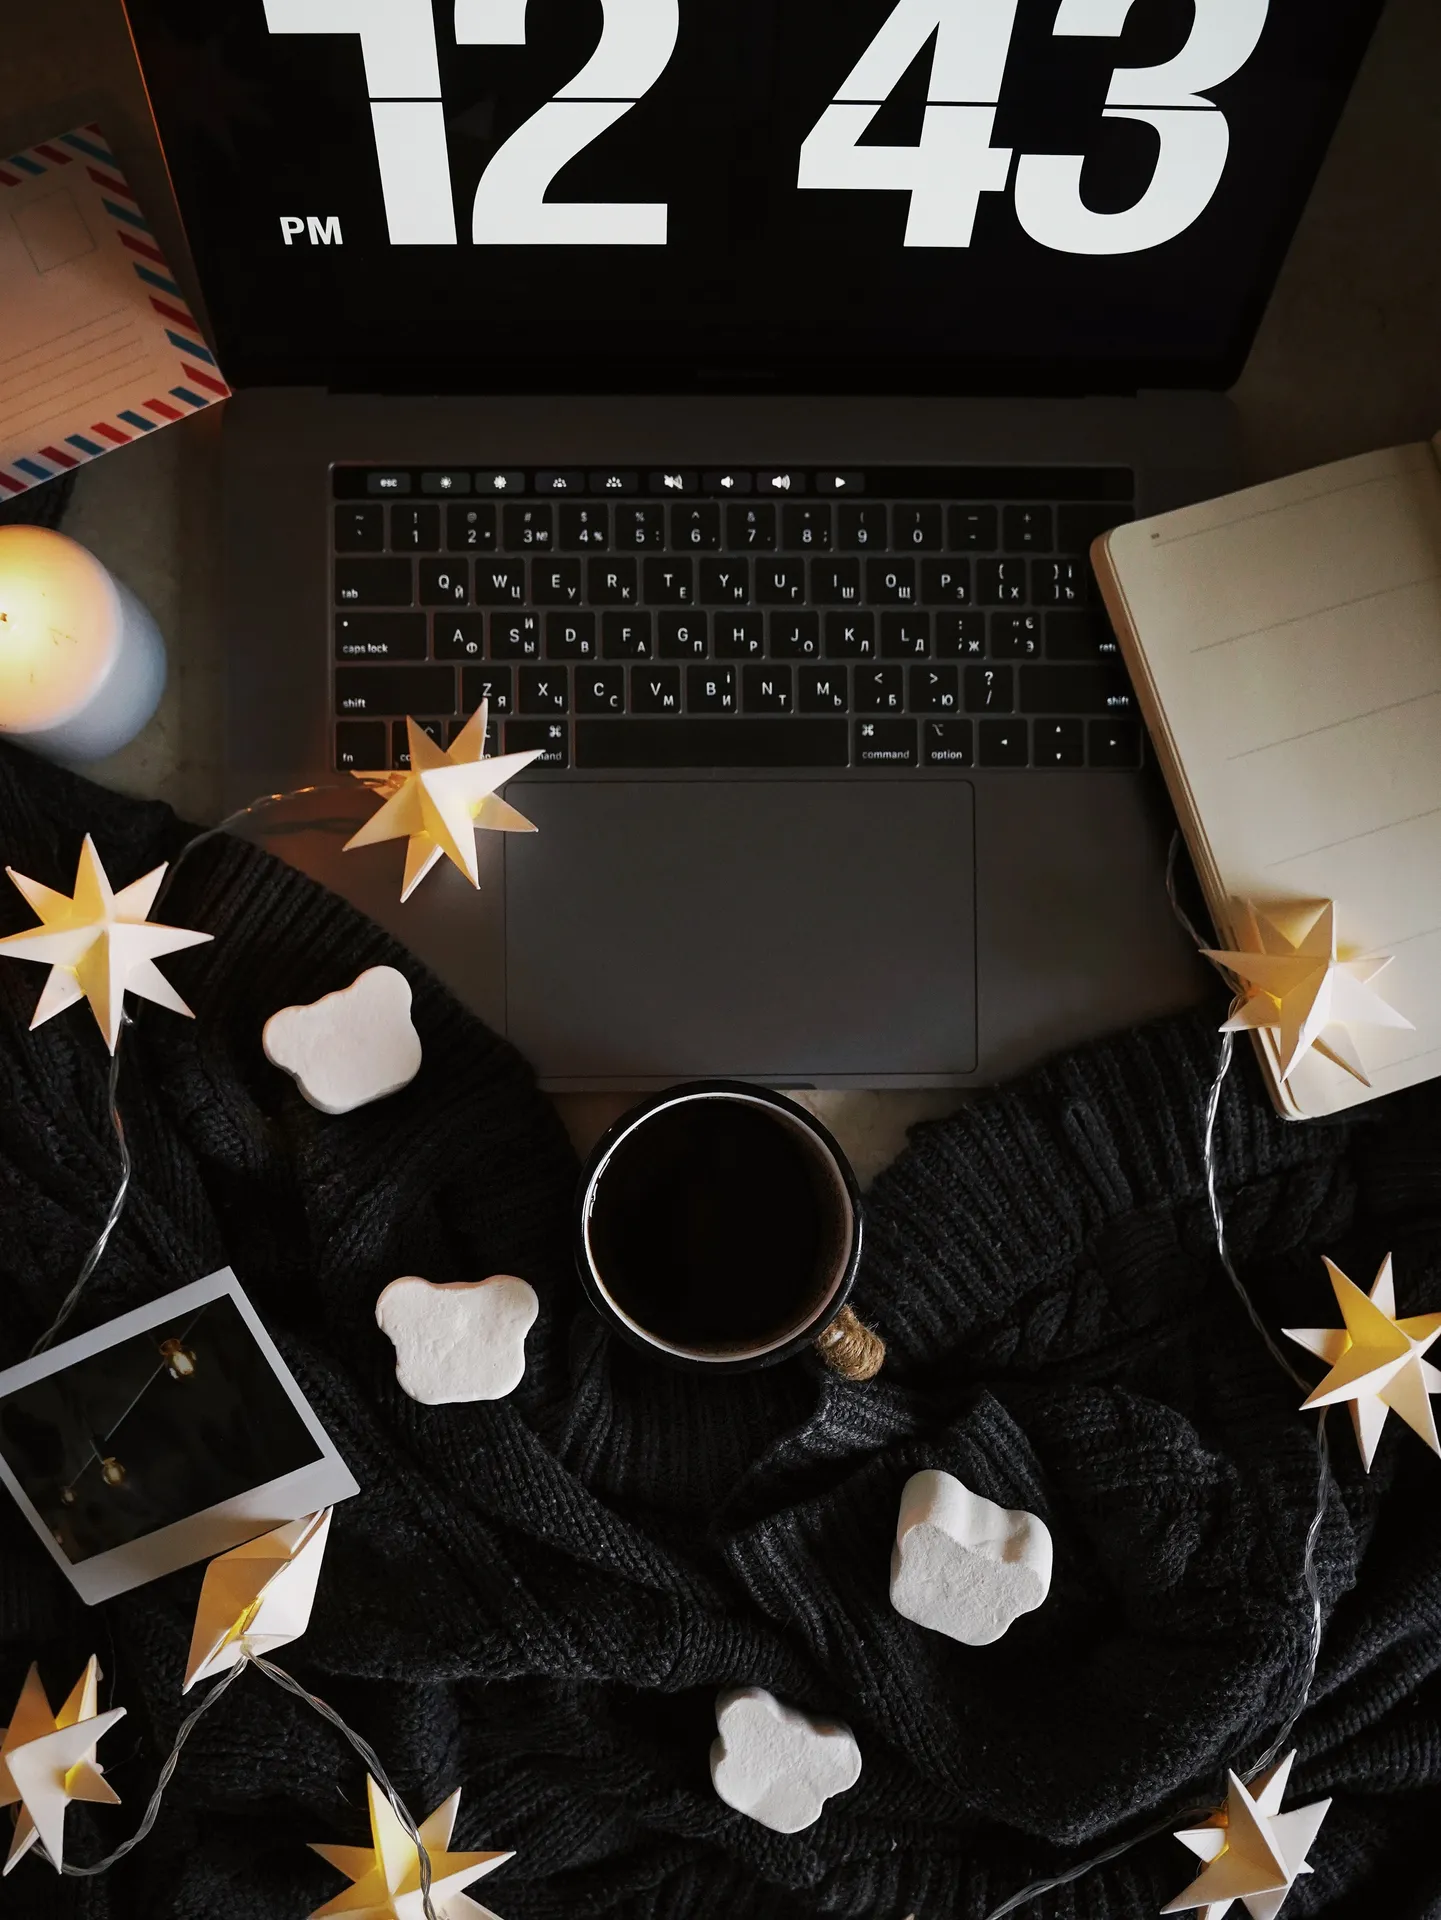
![Working With Coffee Aesthetic Wallpaper]()
Working With Coffee Aesthetic Wallpaper -
![Exquisite Blooms of White Orchids Wallpaper]()
Exquisite Blooms of White Orchids Wallpaper -
![Thomas Partey Wearing A White And Red Uniform Wallpaper]()
Thomas Partey Wearing A White And Red Uniform Wallpaper -
![Aerial View Of Osh City Wallpaper]()
Aerial View Of Osh City Wallpaper -
![Pictures On Wall Pinterest Laptop Wallpaper]()
Pictures On Wall Pinterest Laptop Wallpaper -
![MacBook Air 4K Purple Lights Wallpaper]()
MacBook Air 4K Purple Lights Wallpaper -
![England Football Leather Background Wallpaper]()
England Football Leather Background Wallpaper -
![Straightforward Work Set-up Wallpaper]()
Straightforward Work Set-up Wallpaper -
![Aesthetic Inspirational Star Quote Laptop Wallpaper]()
Aesthetic Inspirational Star Quote Laptop Wallpaper -
![The Majestic Giza Pyramids under Sunny Egyptian Skies Wallpaper]()
The Majestic Giza Pyramids under Sunny Egyptian Skies Wallpaper -
![Anderson Silva Squatting Octagon Wallpaper]()
Anderson Silva Squatting Octagon Wallpaper -
![Unique Laptop Futuristic Astronaut Background Wallpaper]()
Unique Laptop Futuristic Astronaut Background Wallpaper -
![Approaching The Museum Of Islamic Art Wallpaper]()
Approaching The Museum Of Islamic Art Wallpaper -
![Man In Black With A Snowboard Wallpaper]()
Man In Black With A Snowboard Wallpaper -
![Fanart Of Valorant Champ Reyna Wallpaper]()
Fanart Of Valorant Champ Reyna Wallpaper -
![Glowing Red Asus Rog Logo Wallpaper]()
Glowing Red Asus Rog Logo Wallpaper -
![Thomas Partey Running To You Wallpaper]()
Thomas Partey Running To You Wallpaper -
![Splash Laptop 1366 X 768 Wallpaper]()
Splash Laptop 1366 X 768 Wallpaper -
![Cute Pastel Watermelon Pattern Design Wallpaper]()
Cute Pastel Watermelon Pattern Design Wallpaper -
![Hashirama Senju and Fellow Naruto Characters in Action Wallpaper]()
Hashirama Senju and Fellow Naruto Characters in Action Wallpaper -
![Red Aesthetic Laptop Teal Rectangle Wallpaper]()
Red Aesthetic Laptop Teal Rectangle Wallpaper -
![Intensely Giddy During Work Wallpaper]()
Intensely Giddy During Work Wallpaper -
![Halloween Ghost Pattern Laptop Art Wallpaper]()
Halloween Ghost Pattern Laptop Art Wallpaper -
![Laptop With Spotify Playlist Covers Dark Photograph Wallpaper]()
Laptop With Spotify Playlist Covers Dark Photograph Wallpaper -
![Anderson Silva Kick Opponent Head Wallpaper]()
Anderson Silva Kick Opponent Head Wallpaper - Next page


-
![1080p Wallpaper]()
1080p Wallpapers
-
![1366x768 Wallpaper]()
1366x768 Wallpapers
-
![1440p Wallpaper]()
1440p Wallpapers
-
![1600x900 Wallpaper]()
1600x900 Wallpapers
-
![1920x1080 Wallpaper]()
1920x1080 Wallpapers
-
![1920x1200 Wallpaper]()
1920x1200 Wallpapers
-
![2048x1152 Wallpaper]()
2048x1152 Wallpapers
-
![2560x1080 Wallpaper]()
2560x1080 Wallpapers
-
![2560x1440 Wallpaper]()
2560x1440 Wallpapers
-
![3440x1440 Wallpaper]()
3440x1440 Wallpapers
-
![3840x1080 Wallpaper]()
3840x1080 Wallpapers
-
![3840x2160 Wallpaper]()
3840x2160 Wallpapers
-
![5120x1440 Wallpaper]()
5120x1440 Wallpapers
-
![5760x1080 Wallpaper]()
5760x1080 Wallpapers
-
![5k Wallpaper]()
5k Wallpapers
-
![8k Wallpaper]()
8k Wallpapers
-
![Alienware Wallpaper]()
Alienware Wallpapers
-
![Chromebook Wallpaper]()
Chromebook Wallpapers
-
![Computer Wallpaper]()
Computer Wallpapers
-
![Device Wallpaper]()
Device Wallpapers
-
![Hp Wallpaper]()
Hp Wallpapers
-
![Keyboard Wallpaper]()
Keyboard Wallpapers
-
![Macbook Wallpaper]()
Macbook Wallpapers
-
![Macbook Pro Wallpaper]()
Macbook Pro Wallpapers


